

The 26 August disaster along the Nepal-Tibet border is still being studied. Over the past two days, we have been following the event through satellite imagery, 3D terrain, seismic information, surface-temperature observations and downstream damage assessments.
And, as often happens with rapidly evolving disasters, the story has changed as new evidence has arrived.
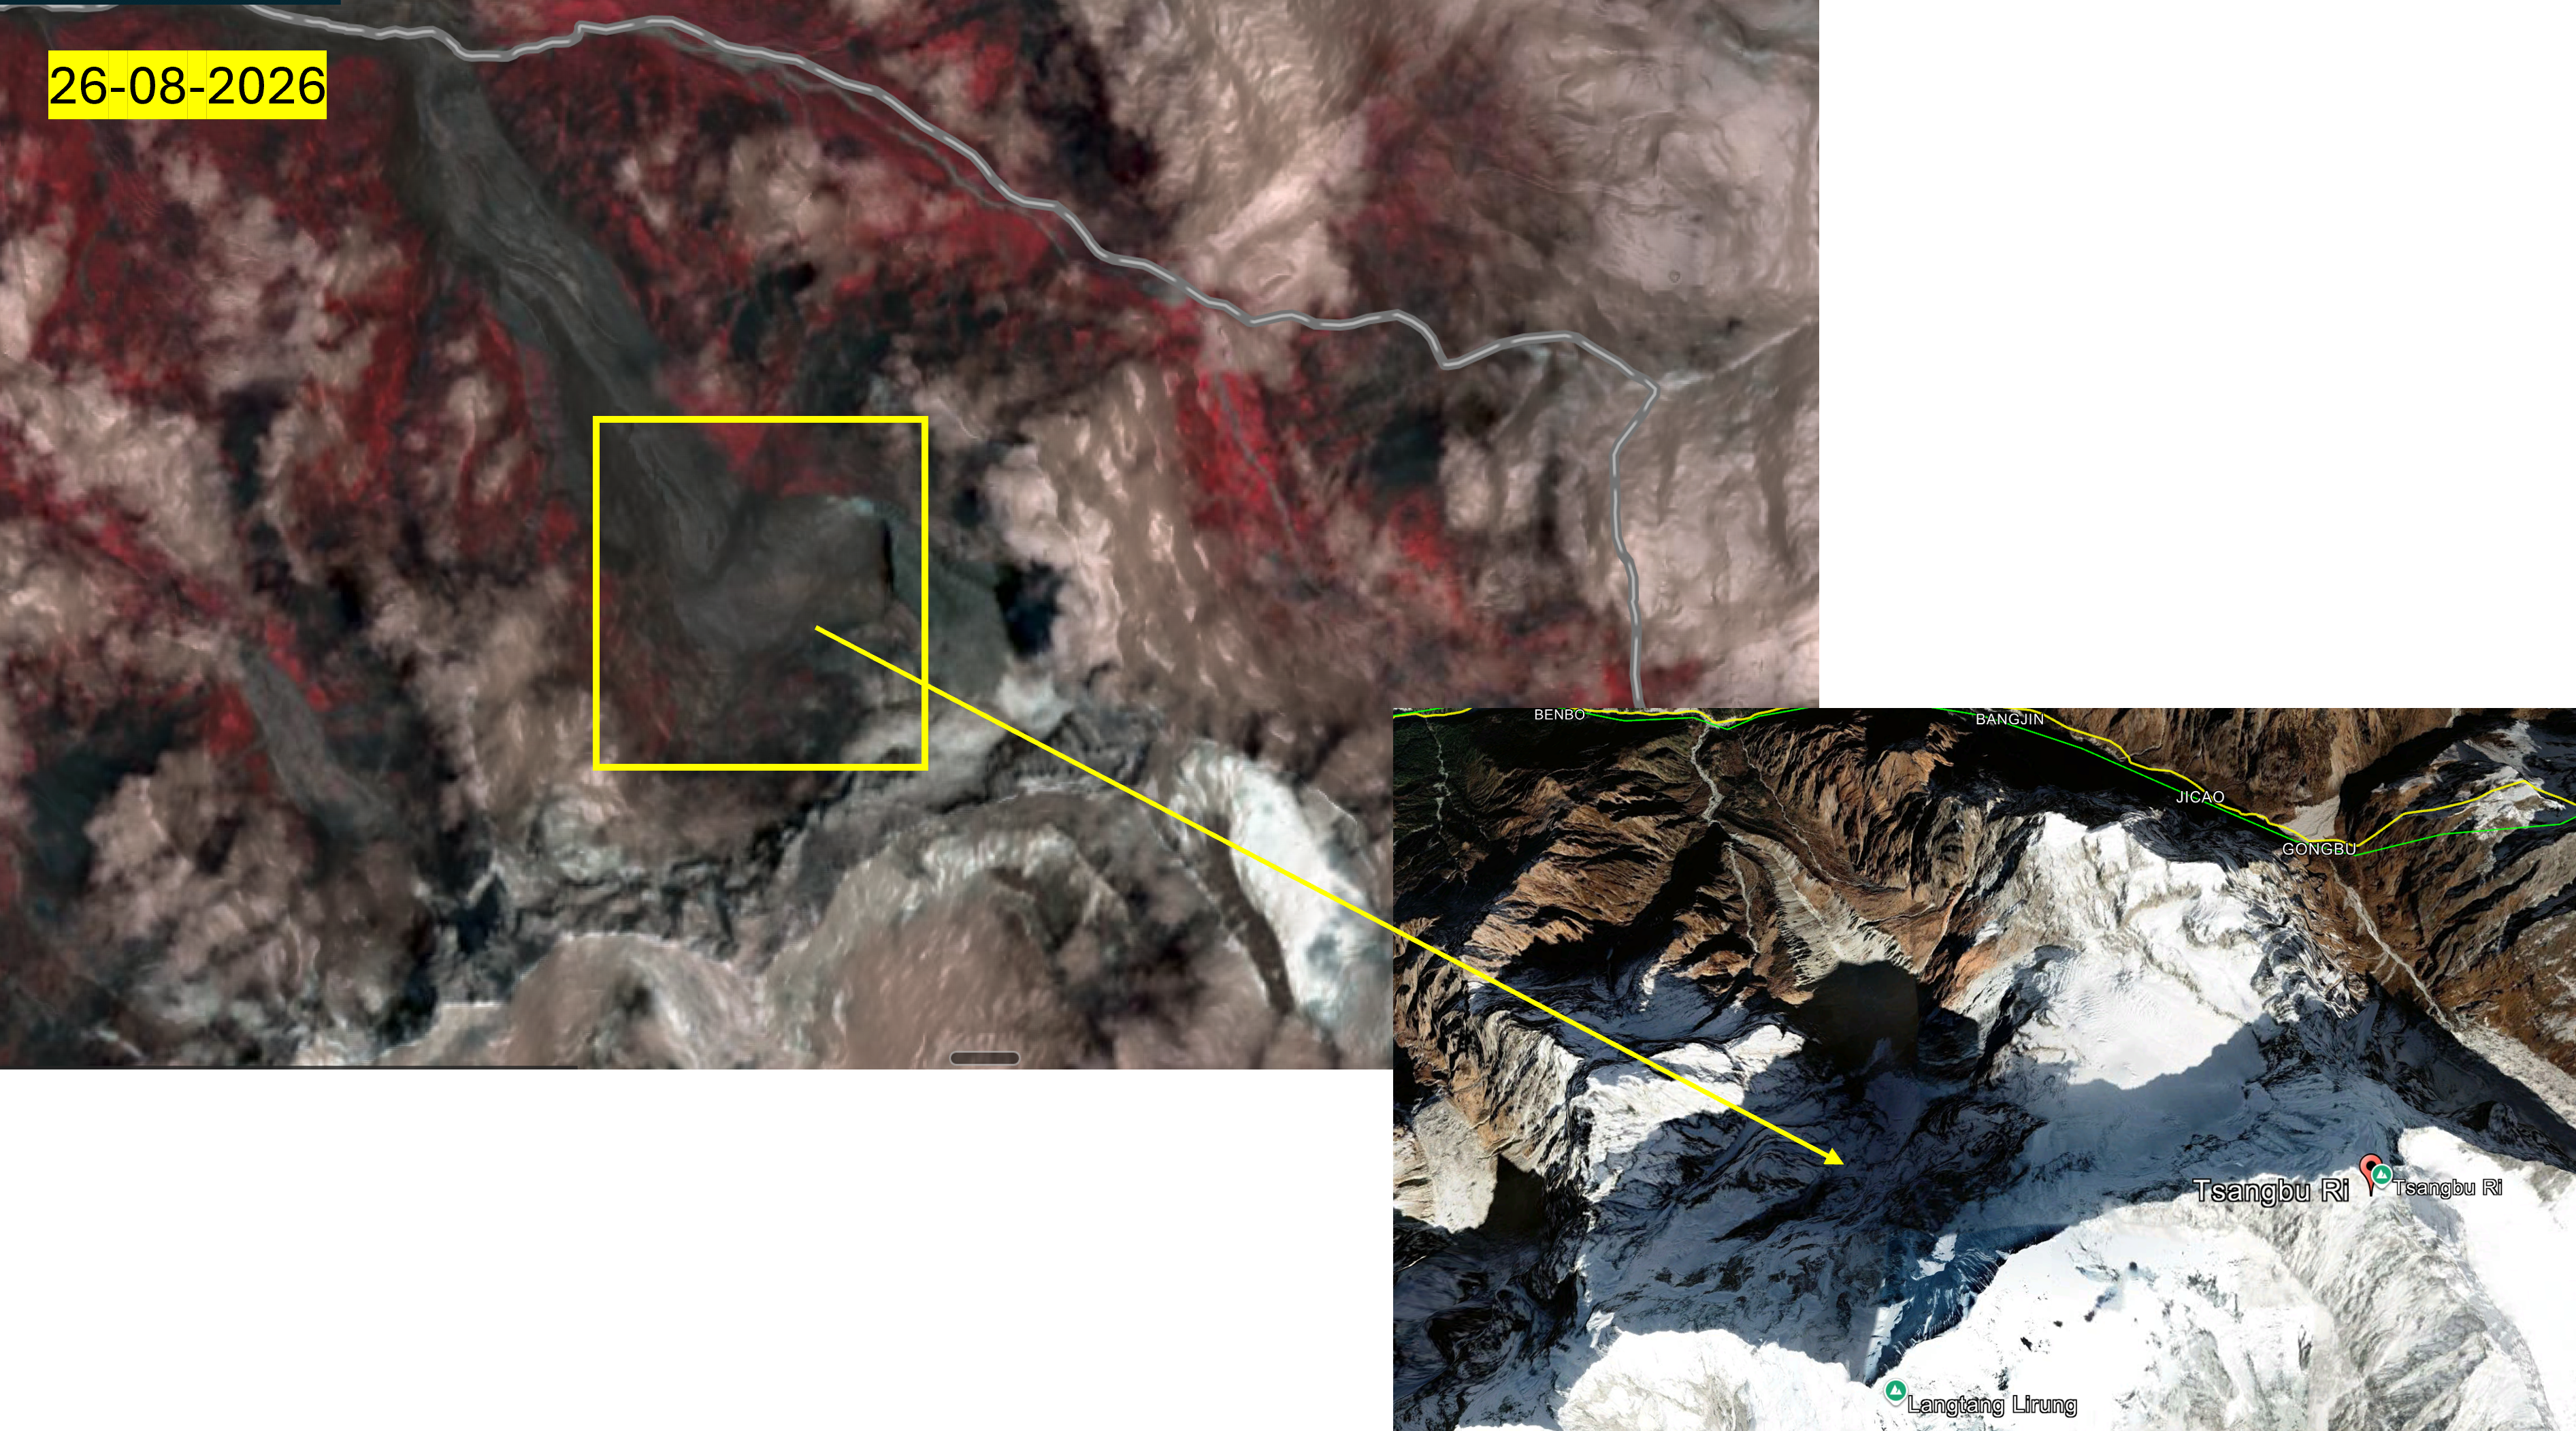
Our initial assessment considered whether a reported seismic event could have triggered the flood. Subsequent information increasingly points in another direction: a major slope failure involving rock and overlying glacier ice on the northern face of Langtang Lirung, on the Nepal side of the border.
What followed appears to have been a cascading event.
Slope failure → ice-rock avalanche → entry into the Lhende River system → mobilisation of water, sediment and debris → rapid downstream surge.
Whether temporary river blockage and release formed part of that sequence still requires further investigation.
What the terrain tells us
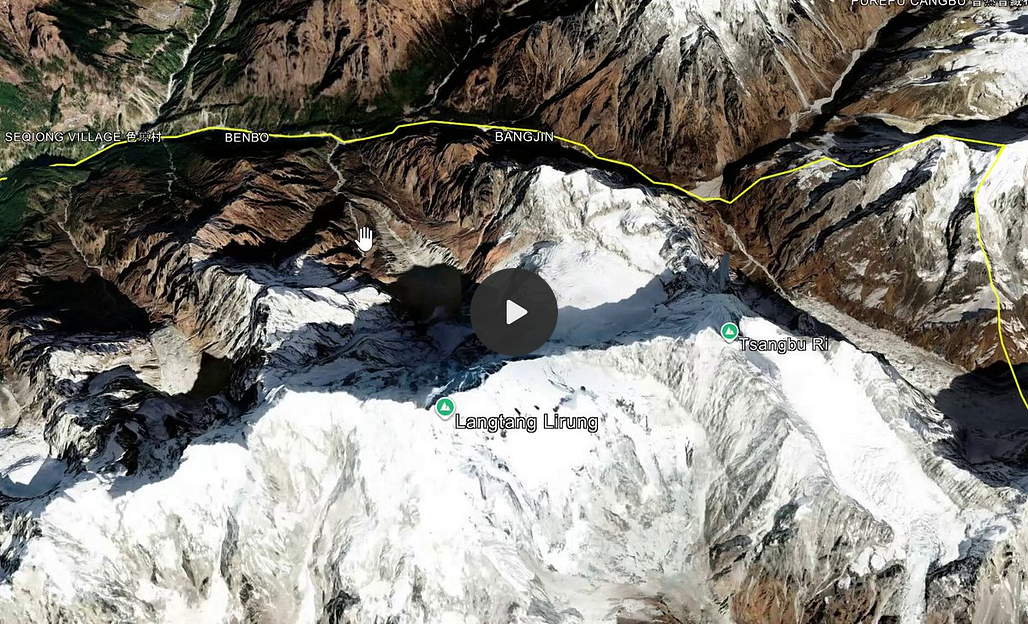
Our 3D reconstruction using pre-event imagery helps explain why a failure high on the mountain could become a major downstream disaster.
First published here:

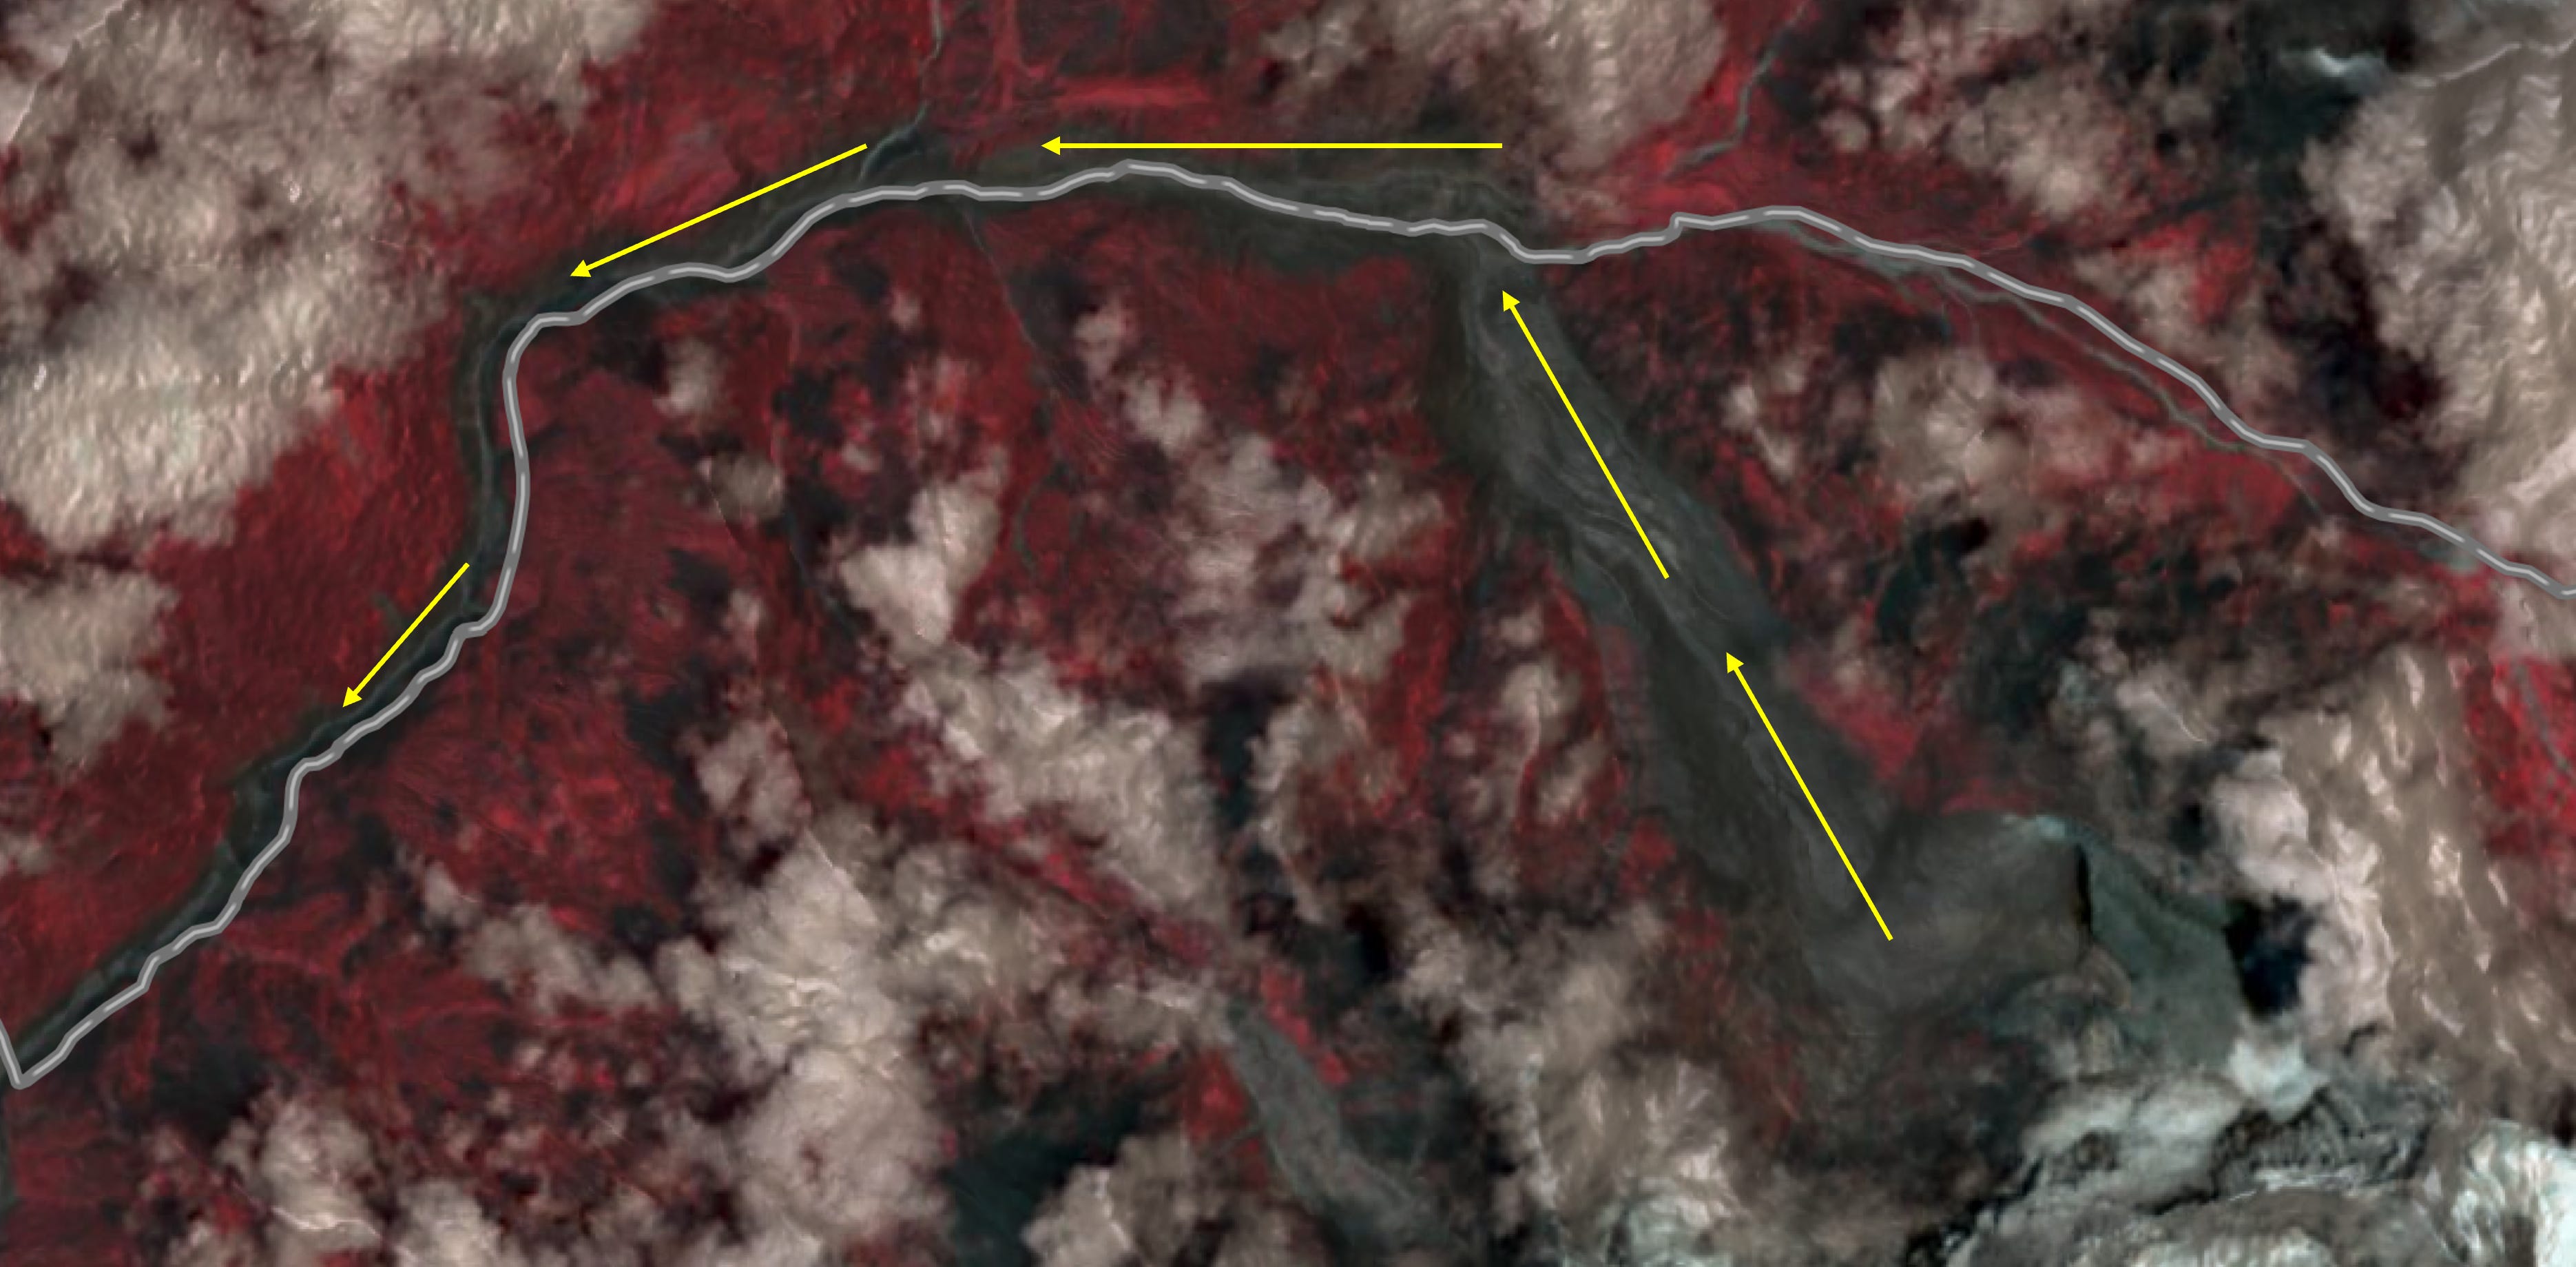
The post-event Landsat image shows the debris entering the northern valley system before being channelled downstream along the existing river course.
The collapse occurred in extremely steep terrain, with the slope directly connected to a deeply confined valley. Once a large volume of rock and ice entered this system, the valley provided an efficient pathway for transferring material and energy downstream.
The impact was therefore not confined to the source area.
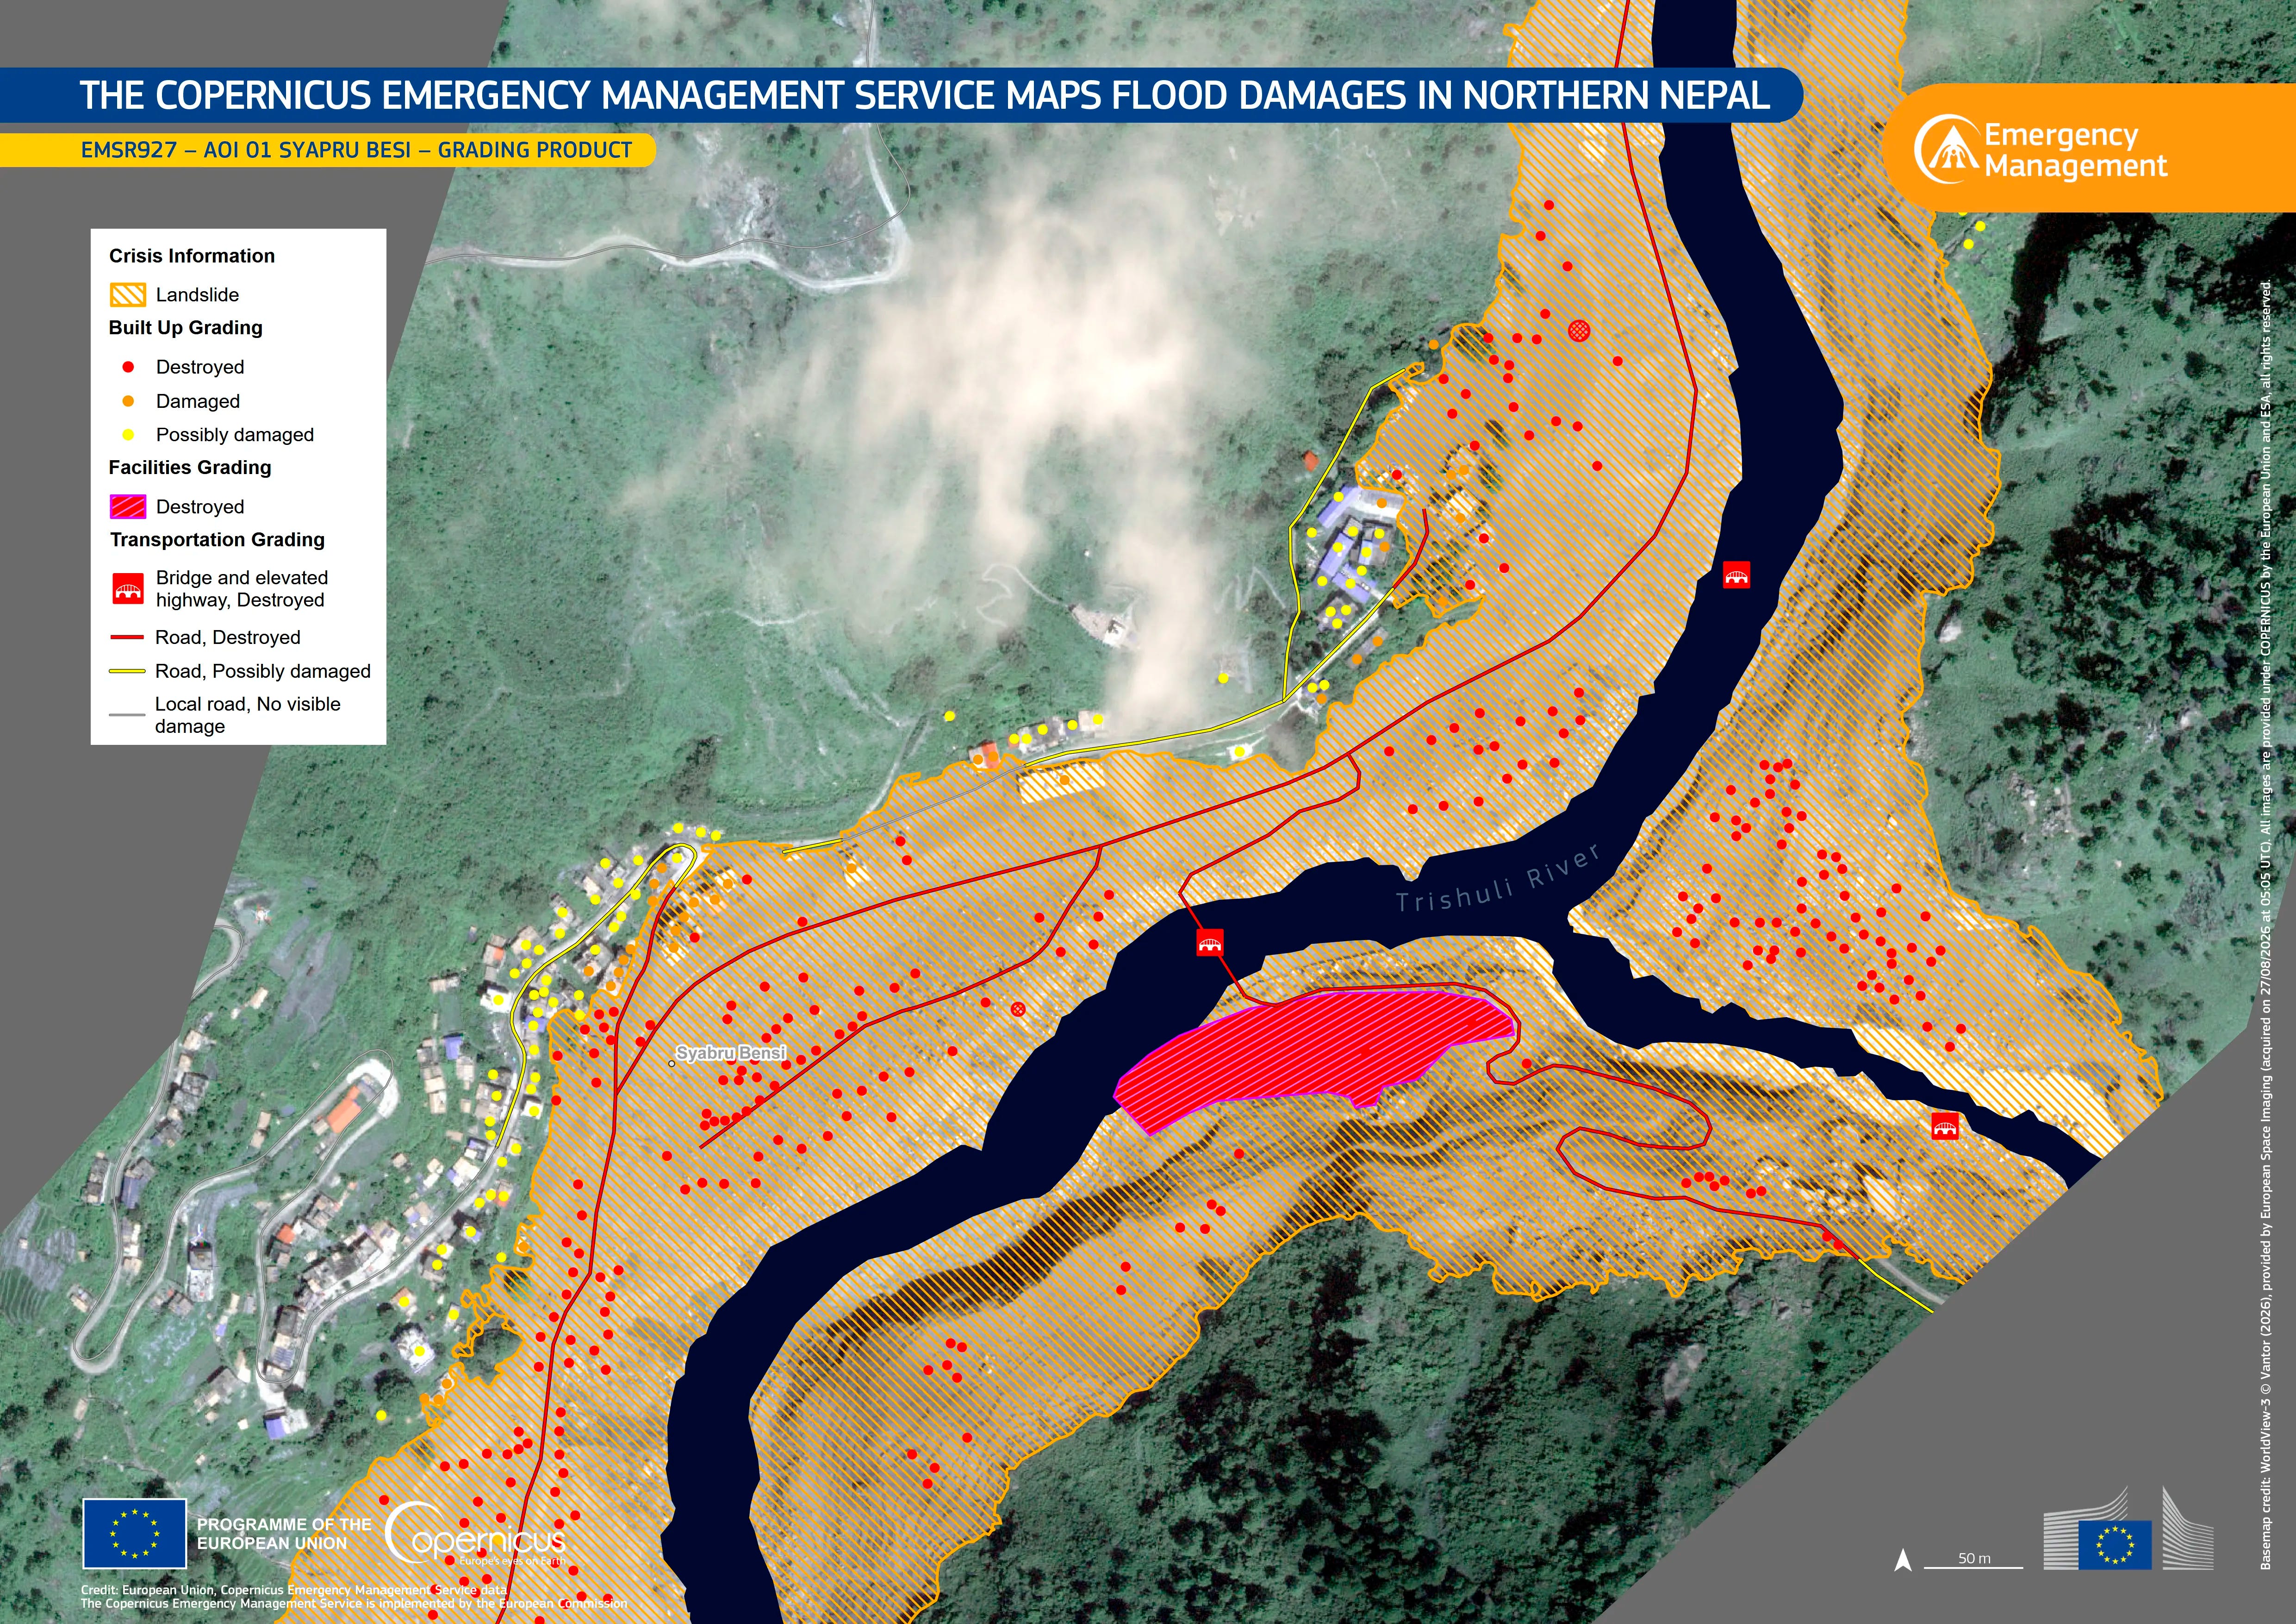
Copernicus Emergency Management Service has now activated Rapid Mapping across four areas of interest. Its assessment around Syapru Besi, using WorldView-3 imagery acquired on 27 August, identified more than 240 buildings as destroyed and another 32 as damaged.
This is what makes the event particularly important from a geospatial perspective. What begins as a relatively localised failure above 5,000 metres can rapidly escalate into a river-basin and transboundary disaster.
Is the mountain environment changing too?
We have also looked at satellite-derived surface-temperature trends at selected high-elevation locations around the wider affected terrain.
The annual values naturally fluctuate. But the fitted temporal trends at the locations we examined are moving upwards, with recent August observations at the warmer end of the record. Individual locations also show differences of several degrees between recent observations and some of the cooler years during the previous five-year period.
References from two different locations around the incident site on the mountaintop are provided below. Both of them largely indicate the increasing trend in the surface temperature.
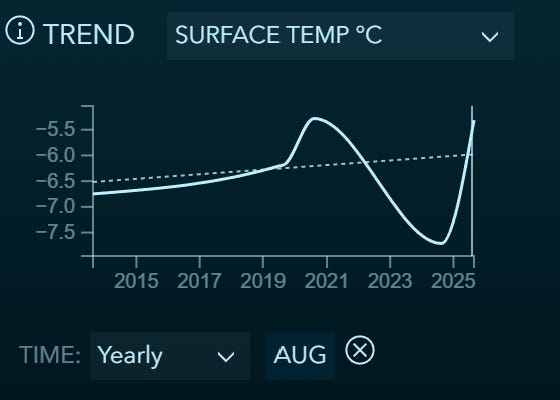
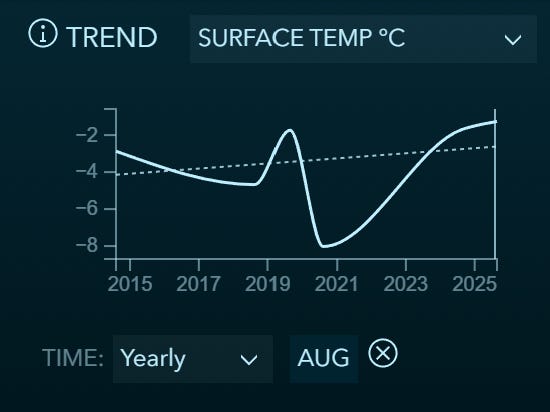
This is not evidence that warming caused the 26 August collapse.
But it is an important part of the environmental background.
Higher surface temperatures can influence snow persistence, glacier melting, freeze-thaw cycles, meltwater movement and potentially the stability of permafrost and fractured mountain slopes. The Himalayas are already naturally susceptible to landslides, avalanches, earthquakes and flash floods. Changing climatic conditions can add another layer of vulnerability.
The distinction is important: we are observing changing conditions, not yet attributing this particular failure to climate change.
The larger Himalayan question
There is also an infrastructure lesson.
Hundreds of hydropower projects are operating, under construction or planned across Nepal and the wider Tibetan region. Projects close to glaciers face hazards from ice collapse, landslides and debris flows, while infrastructure much farther downstream remains exposed to sudden surges, sediment and river blockages.
That is relevant not only to Nepal, but also to the much larger hydropower development taking place across the Tibetan Plateau, including the lower Yarlung Tsangpo around Medog.
For detailed analysis on Medog Dam and its likely impact downstream, read our geospatial bulletin article:

The lesson from 26 August is not that these projects will necessarily face a similar event.
It is that Himalayan infrastructure needs to be designed for cascading hazards, not individual hazards in isolation.
And because rivers cross borders, monitoring must also cross them. Continuous upstream observations, faster hydrological and weather-data sharing, automated warnings and joint scientific assessments between China and Nepal would significantly improve preparedness. Where upstream monitoring is expensive, downstream countries could even co-invest in observation networks and specialised datasets.
This assessment is continuing
This is an ongoing online geospatial assessment, not a final attribution.
As new satellite imagery and scientific information become available, we will continue to monitor the following:
failure scar → debris pathway → river changes → surface-temperature trends → infrastructure impacts → possible secondary hazards.
That is also the value of geospatial intelligence during a rapidly evolving disaster. We observe, form a hypothesis, test it against new evidence, revise where necessary, and continue watching.
For now, one thing is increasingly clear.
What happened on one Himalayan slope on 26 August did not stay there. The terrain connected the rock to the ice, the ice to the river, and the river to communities far downstream.
For quick updates on the topic, follow me at https://x.com/prof_nithiya
Related media discussion: