

For a long time, India’s geospatial community has wished for something basic: an easier way to know where useful geospatial datasets are available. The problem, however, has never been only about access. It is also about where the data comes from and whether it can be trusted.
The problem is not new; I remember the issue from my student days nearly two decades ago. Researchers often downloaded readily available global boundary datasets because they were easy to locate and use, without realising that India’s boundaries were sometimes represented incorrectly. The problem was rarely intent; it was convenience and lack of straightforward access to authoritative data.
Today, India has no shortage of maps, satellite products, administrative layers, or environmental and infrastructure data. The difficulty is often more basic: identifying which organisation holds the relevant information, whether it is current, how it can be accessed, and whether it is available in a form that can be used in a GIS workflow.
Takshashila’s India Geoportal Catalogue is a modest step towards achieving that goal.
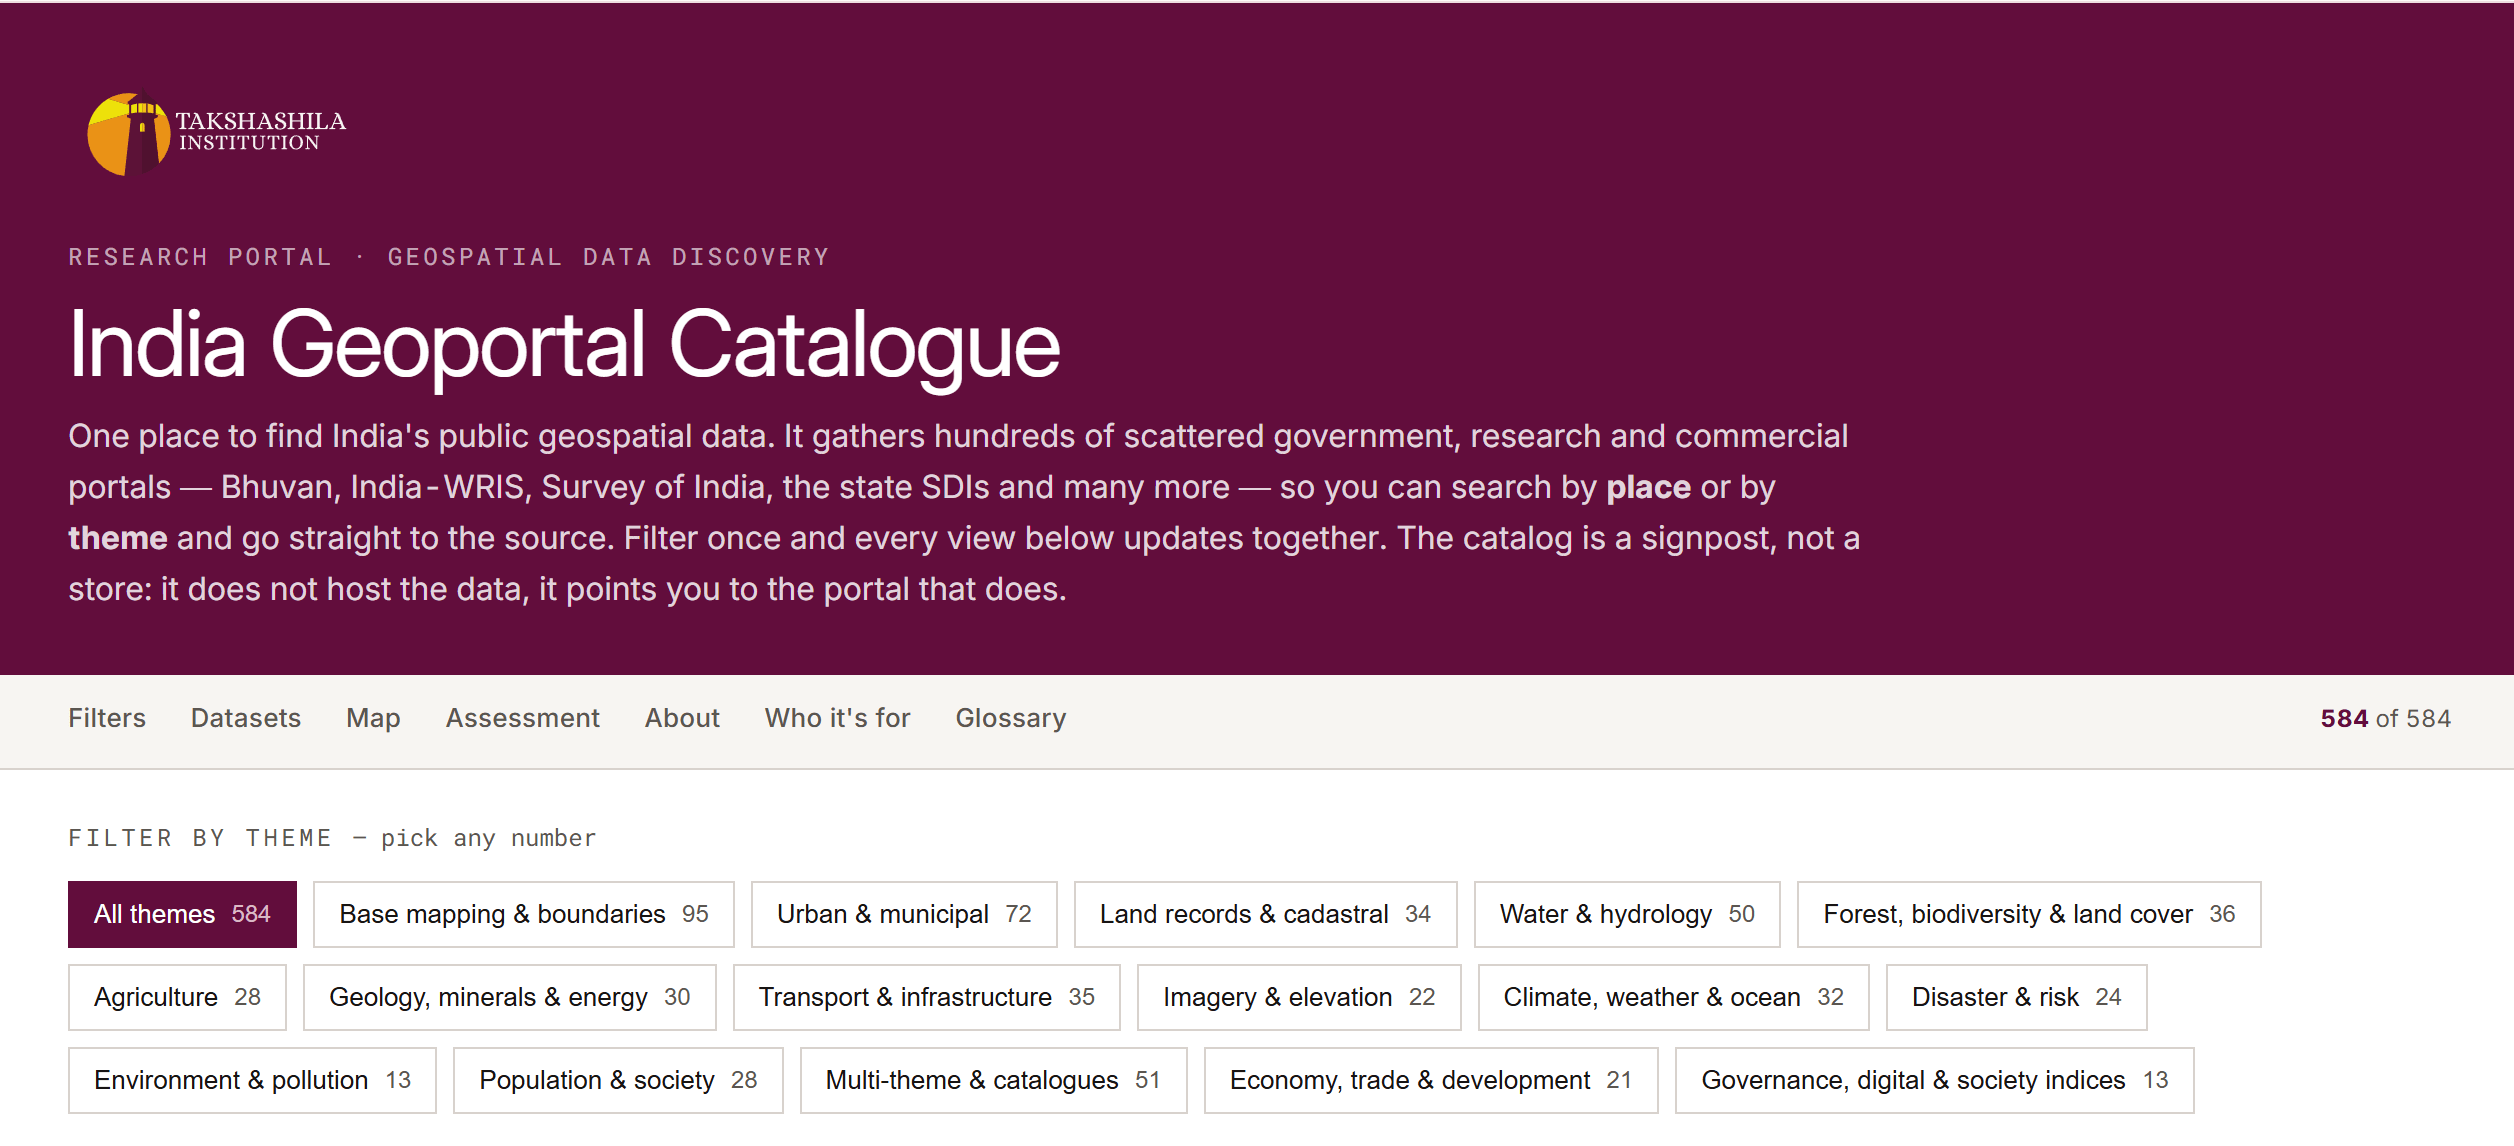
It is important to clarify what the catalogue is and what it is not. It is not a data provider. It is not a unified geoportal. The catalogue sits above the source portals. It helps users identify and compare possible sources; the original institutions remain responsible for the data.
The catalogue currently brings together 584 datasets from Indian and international sources. It continuously evolves as we identify more datasets and portals. The number is therefore not a claim that the catalogue attempts to capture the whole of India’s geospatial universe. It is a working index of a much larger and steadily expanding landscape.
So where do we start this edition? Let’s look at why discoverability has become a strategic problem, how the catalogue is structured, and what it means for anyone working with data related to India, its boundaries and its changing physical landscape.
1. The Backstory
India’s geospatial ecosystem has developed through a long transition from restricted access to wider participation and use.
Concerns relating to sovereignty, territorial integrity and national security historically shaped mapping and high-resolution spatial information. The National Map Policy 2005 introduced Open Series Maps while retaining restrictions around higher-resolution information. The National Data Sharing and Accessibility Policy 2011 sought to increase the availability of non-sensitive government data.
The major change came with the 2021 Guidelines for Acquiring and Producing Geospatial Data and Geospatial Data Services. These guidelines liberalised the acquisition, production and dissemination of geospatial information and opened greater space for private firms, researchers, universities and other non-governmental actors.
The National Geospatial Policy 2022 extended this direction. Its objectives included wider access to publicly funded geospatial information, a stronger role for private participation, and the use of geospatial technologies in governance, agriculture, logistics, infrastructure, disaster management, urban planning and environmental monitoring.
The policy also recognised that data availability alone would not be enough. It envisaged a National Geospatial Data Registry and a Unified Geospatial Interface. Both ideas addressed a practical problem: if data is distributed across many institutions, users need a way to discover it without knowing the entire administrative structure of the state.
This is the point at which India’s geospatial story has arrived.
India now has more geospatial data, more portals and more data producers than ever before. The irony is that finding the right dataset can still feel like a geospatial exercise in itself. A researcher may know the data exists, yet spend hours locating the portal, testing links, figuring out how to download it, and finally decoding what the terms of use actually allow.
The problem has shifted from access alone to discoverability, usability and confidence.
2. When the portals multiplied
India’s geospatial platforms reflect the strengths of the institutions that operate them.
The National Remote Sensing Centre’s Bhuvan provides satellite imagery, thematic layers, visualisation tools and applications. Bhoonidhi serves as a dedicated access point for satellite data. India-WRIS brings together information on water resources. The National Database for Emergency Management supports disaster-management applications. MOSDAC provides meteorological and oceanographic satellite data. Survey of India maintains official mapping and cadastral products.
Other institutions add domain-specific information. The Forest Survey of India contributes forest and land-cover datasets. The Central Groundwater Board provides groundwater-related information. The India Meteorological Department and other scientific agencies support weather and climate analysis. State remote-sensing centres and state spatial-data infrastructures provide information that is essential for district-level work.
This distribution is not necessarily a weakness. It is often sensible for domain institutions to produce and maintain the data related to their responsibilities. Water agencies know their hydrological systems. Mapping agencies maintain foundational geographic information. Space organisations manage archives of Earth observation data. Disaster-management bodies understand the operational context of hazard data.
The difficulty appears when a research question crosses institutional boundaries.
For example, mapping flood exposure of a district requires elevation, rainfall, river discharge, settlements, roads, land use, administrative boundaries, embankments and historical disaster records. Multiple agencies may hold these layers, publish them on different websites, describe them using different metadata practices, and supply them in different formats. The data exists. The map of where the data exists is harder to discover.
Our earlier assessment, State of India’s Geospatial Portals, identified this fragmentation across organisations, including the Survey of India, NRSC, NITI Aayog, NIC, INCOIS and state agencies. It also pointed to limited integration, inconsistent/weak metadata, technical constraints, uneven user experience, regulatory uncertainty and limited public awareness.
3. The Catalogue
The India Geoportal Catalogue is designed as a signpost rather than a warehouse.
Users can search by the source, data type, geographic coverage, timeframe, file format, download availability, access tier and licence category.
The intended workflow is straightforward:
Discover → Filter → Examine → Go to source
This sequence is important because most users do not begin with the formal name of a dataset or the institution that maintains it. They begin with a question.
What data is available for Arunachal Pradesh?
Which sources can help examine groundwater in Karnataka?
Where can one obtain forest or land-cover data for a border district?
What hazard layers are available for Assam?
Which portals provide roads, settlements or infrastructure data for a particular region?
A place-first search allows users to start from geography rather than institutional knowledge. A theme-first search supports users who know the problem they are investigating but not the organisation that has the answer.
The catalogue also brings Indian and international sources together. This matters because a research question may require national datasets, global environmental products, commercial imagery or international scientific archives. The catalogue does not imply that these sources are equivalent.
It helps users see the data available for India from Indian and other global sources.
The distinction between the catalogue and the source portal is central. The original institution remains responsible for the data. Its portal remains the authoritative place to verify content, format, access and licence conditions.
The catalogue just helps users reach that point more quickly.
3.1 What the catalogue records
A portal’s existence is a weak measure of its usefulness. A dataset may be visible on a screen but unavailable for download. A file may be downloadable but unsuitable for GIS. A service may be technically available but poorly documented. A link may lead to a live website but not to the resource described in the catalogue.
For this reason, the catalogue records more than names and URLs.
Its assessment considers six practical parameters:
Download capability: whether the data can be downloaded rather than only viewed.
Open and free access: whether users can obtain it without payment or restrictive barriers.
GIS-ready formats: whether it is provided in formats that are suitable for spatial analysis.
Data recency: whether the age and update status are clear and appropriate.
API and web-service availability: whether the data can be accessed programmatically or through interoperable services.
Link reliability: whether the source is live and leads to the expected resource.
The catalogue uses these parameters to generate a comparative usability view of the records currently selected by the user. The result indicates how accessible and usable the selected resources appear; it does not certify their authority, accuracy or suitability for every application.
3.2 The resources bucket
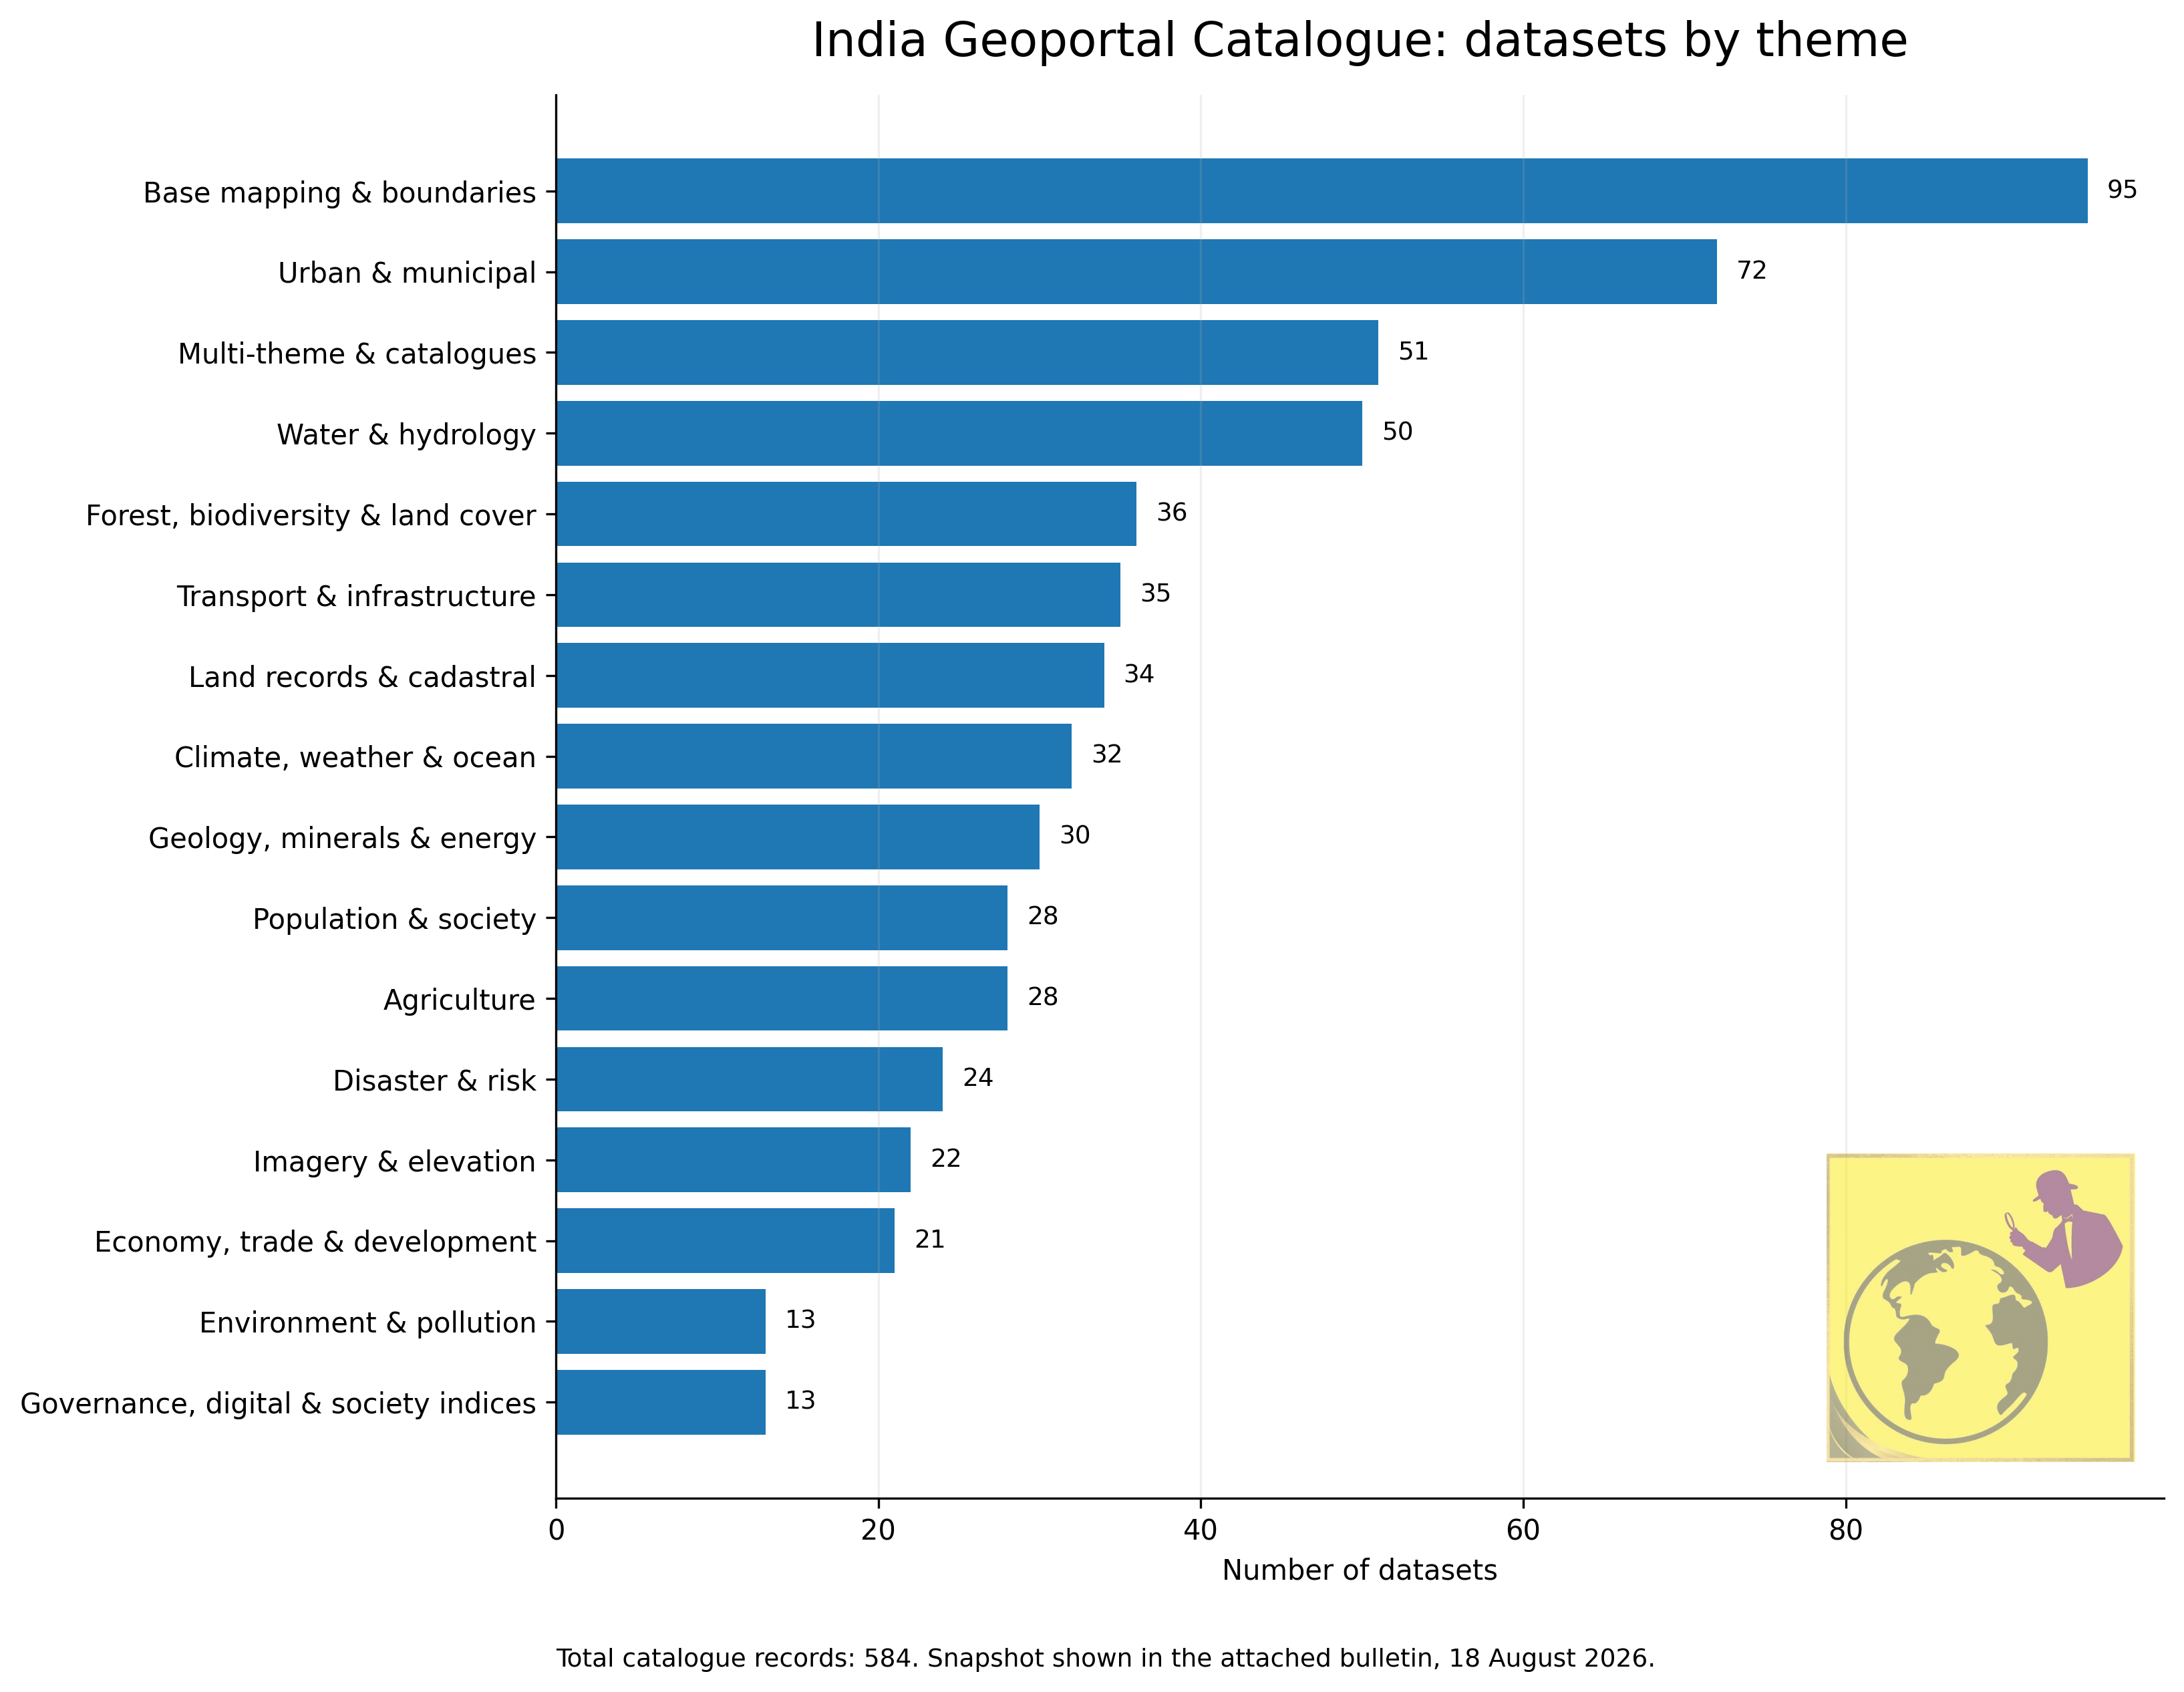
The catalogue’s 584 records cover a broad range of themes. The broader discovery landscape includes water, land records, forests and land cover, disaster management, urban information, agriculture, transport, weather, satellite imagery, administrative boundaries, coastal and marine information, energy, demographics and geology.
This diversity is important for strategic research because questions relating to territory usually span multiple thematic categories.
A border infrastructure assessment may need roads and bridges, elevation and slope, settlements, forest cover, rainfall, administrative boundaries and satellite imagery. A maritime study may combine coastlines, ports, shipping routes, bathymetry, weather and vessel-related information. A district-development analysis may require census data, roads, power, communications, land use and public-service locations.
The catalogue can make those connections easier to identify.
The most important step remains the last one. A catalogue record is a starting point, not a substitute for checking the original source.
3.3 what is happening behind the screen
Some datasets may be openly downloadable. Others may be free but restricted to registered users, academic users or approved applications. Some may provide a web service without a direct file download. Some may be available through a commercial provider. Others may have mixed conditions depending on the product or resolution.
This is why the catalogue distinguishes between ‘Access Tier’ and ‘Licence Category’.
‘Access Tier’ describes the practical gate encountered by the user: open/free, free (restricted), free (academic), mixed, paid or not specified. ‘Licence category’ refers to the legal terms that apply to the source material.
A source may be freely viewable but restricted for download. Another may provide some layers openly while requiring approval or payment for others. A dataset may be available for academic use but not for redistribution.
The catalogue is not licence clearance. Users must examine the original terms before reuse, publication, redistribution or commercial application.
The same caution applies to links. A website may be live, but the described dataset may have moved, been replaced or become inaccessible. A link may lead to a portal where further navigation is required. Link verification is therefore part of data quality, not merely a technical housekeeping exercise.
A broken link is a break in the chain of evidence.
4. Problems to fix beyond the catalogue
Two major problems, according to me, are metadata and visibility.
4.1 the metadata
Metadata indicates the producer, representation, creation or update date, applicability, coordinate reference system, accuracy, generation method, and reuse conditions of the data.
The Takshashila portal assessment identified limited metadata as a recurring weakness. It also noted that some maps remain available mainly as PDFs or in formats requiring additional processing before they can be used effectively in GIS.
This is relevant particularly for boundary research.
An administrative boundary layer may reflect a specific legal or cartographic convention. A dataset may show an international boundary without explaining the source, date or status of the representation. A settlement layer may be appropriate for national-scale analysis but unsuitable for a detailed infrastructure study. A satellite scene may be recent but affected by cloud, acquisition geometry or processing choices.
Metadata allows the analyst to distinguish these cases.
It also supports reproducibility. A defensible analysis should preserve the source link, access date, dataset date or version, coordinate reference system, resolution and relevant terms of use. Without this information, a result may be difficult to recreate even when the map itself looks convincing.
A discovery catalogue cannot manufacture missing metadata at the source. It can reveal what is documented, flag uncertainty and direct users to the institution responsible for clarification.
4.2 The visibility
The assessment identified six broad categories of constraints across India’s geospatial portal ecosystem: lack of integration between organisations, a shortage of skilled professionals, limited public awareness, technical infrastructure problems, legal and regulatory barriers, and insufficient funding.
The catalogue cannot solve all six.
It cannot repair a slow server, update an old satellite scene, resolve an unclear licence, standardise every coordinate reference system or remove institutional silos. It cannot create a dataset that has never been published.
What it can address is visibility.
A discovery layer can help a user move from a question to a plausible source. It can make scattered resources easier to compare. It can show whether a dataset appears downloadable, GIS-ready, recent, service-enabled or difficult to access. It can make the limitations of a data journey more apparent before the user invests hours in it.
That is a modest intervention, but it responds to a practical problem faced by almost everyone who has worked across India’s geospatial portals.
5. The international lesson
NASA’s Earthdata ecosystem offers one example. Users can search its Earth science holdings by scientific topic, observation method, resolution, format and processing level. Its data systems also support APIs and services that allow users to subset or work with information without always downloading entire collections.
Copernicus illustrates another aspect of the same lesson: Earth-observation products become more useful when they are packaged around practical applications and supported by documentation and tools. Digital Earth Australia demonstrates the value of analysis-ready products that reduce the technical effort required to move from raw data to interpretation.
India does not need to reproduce any of these systems wholesale. India’s institutional structure, security requirements, and policy priorities differ from those of Australia. But the principle is transferable.
As the volume of data grows, a portal is no longer enough. Users need an ecosystem that is searchable, documented, interoperable and maintained.
6. Parting Shot: An evolving process
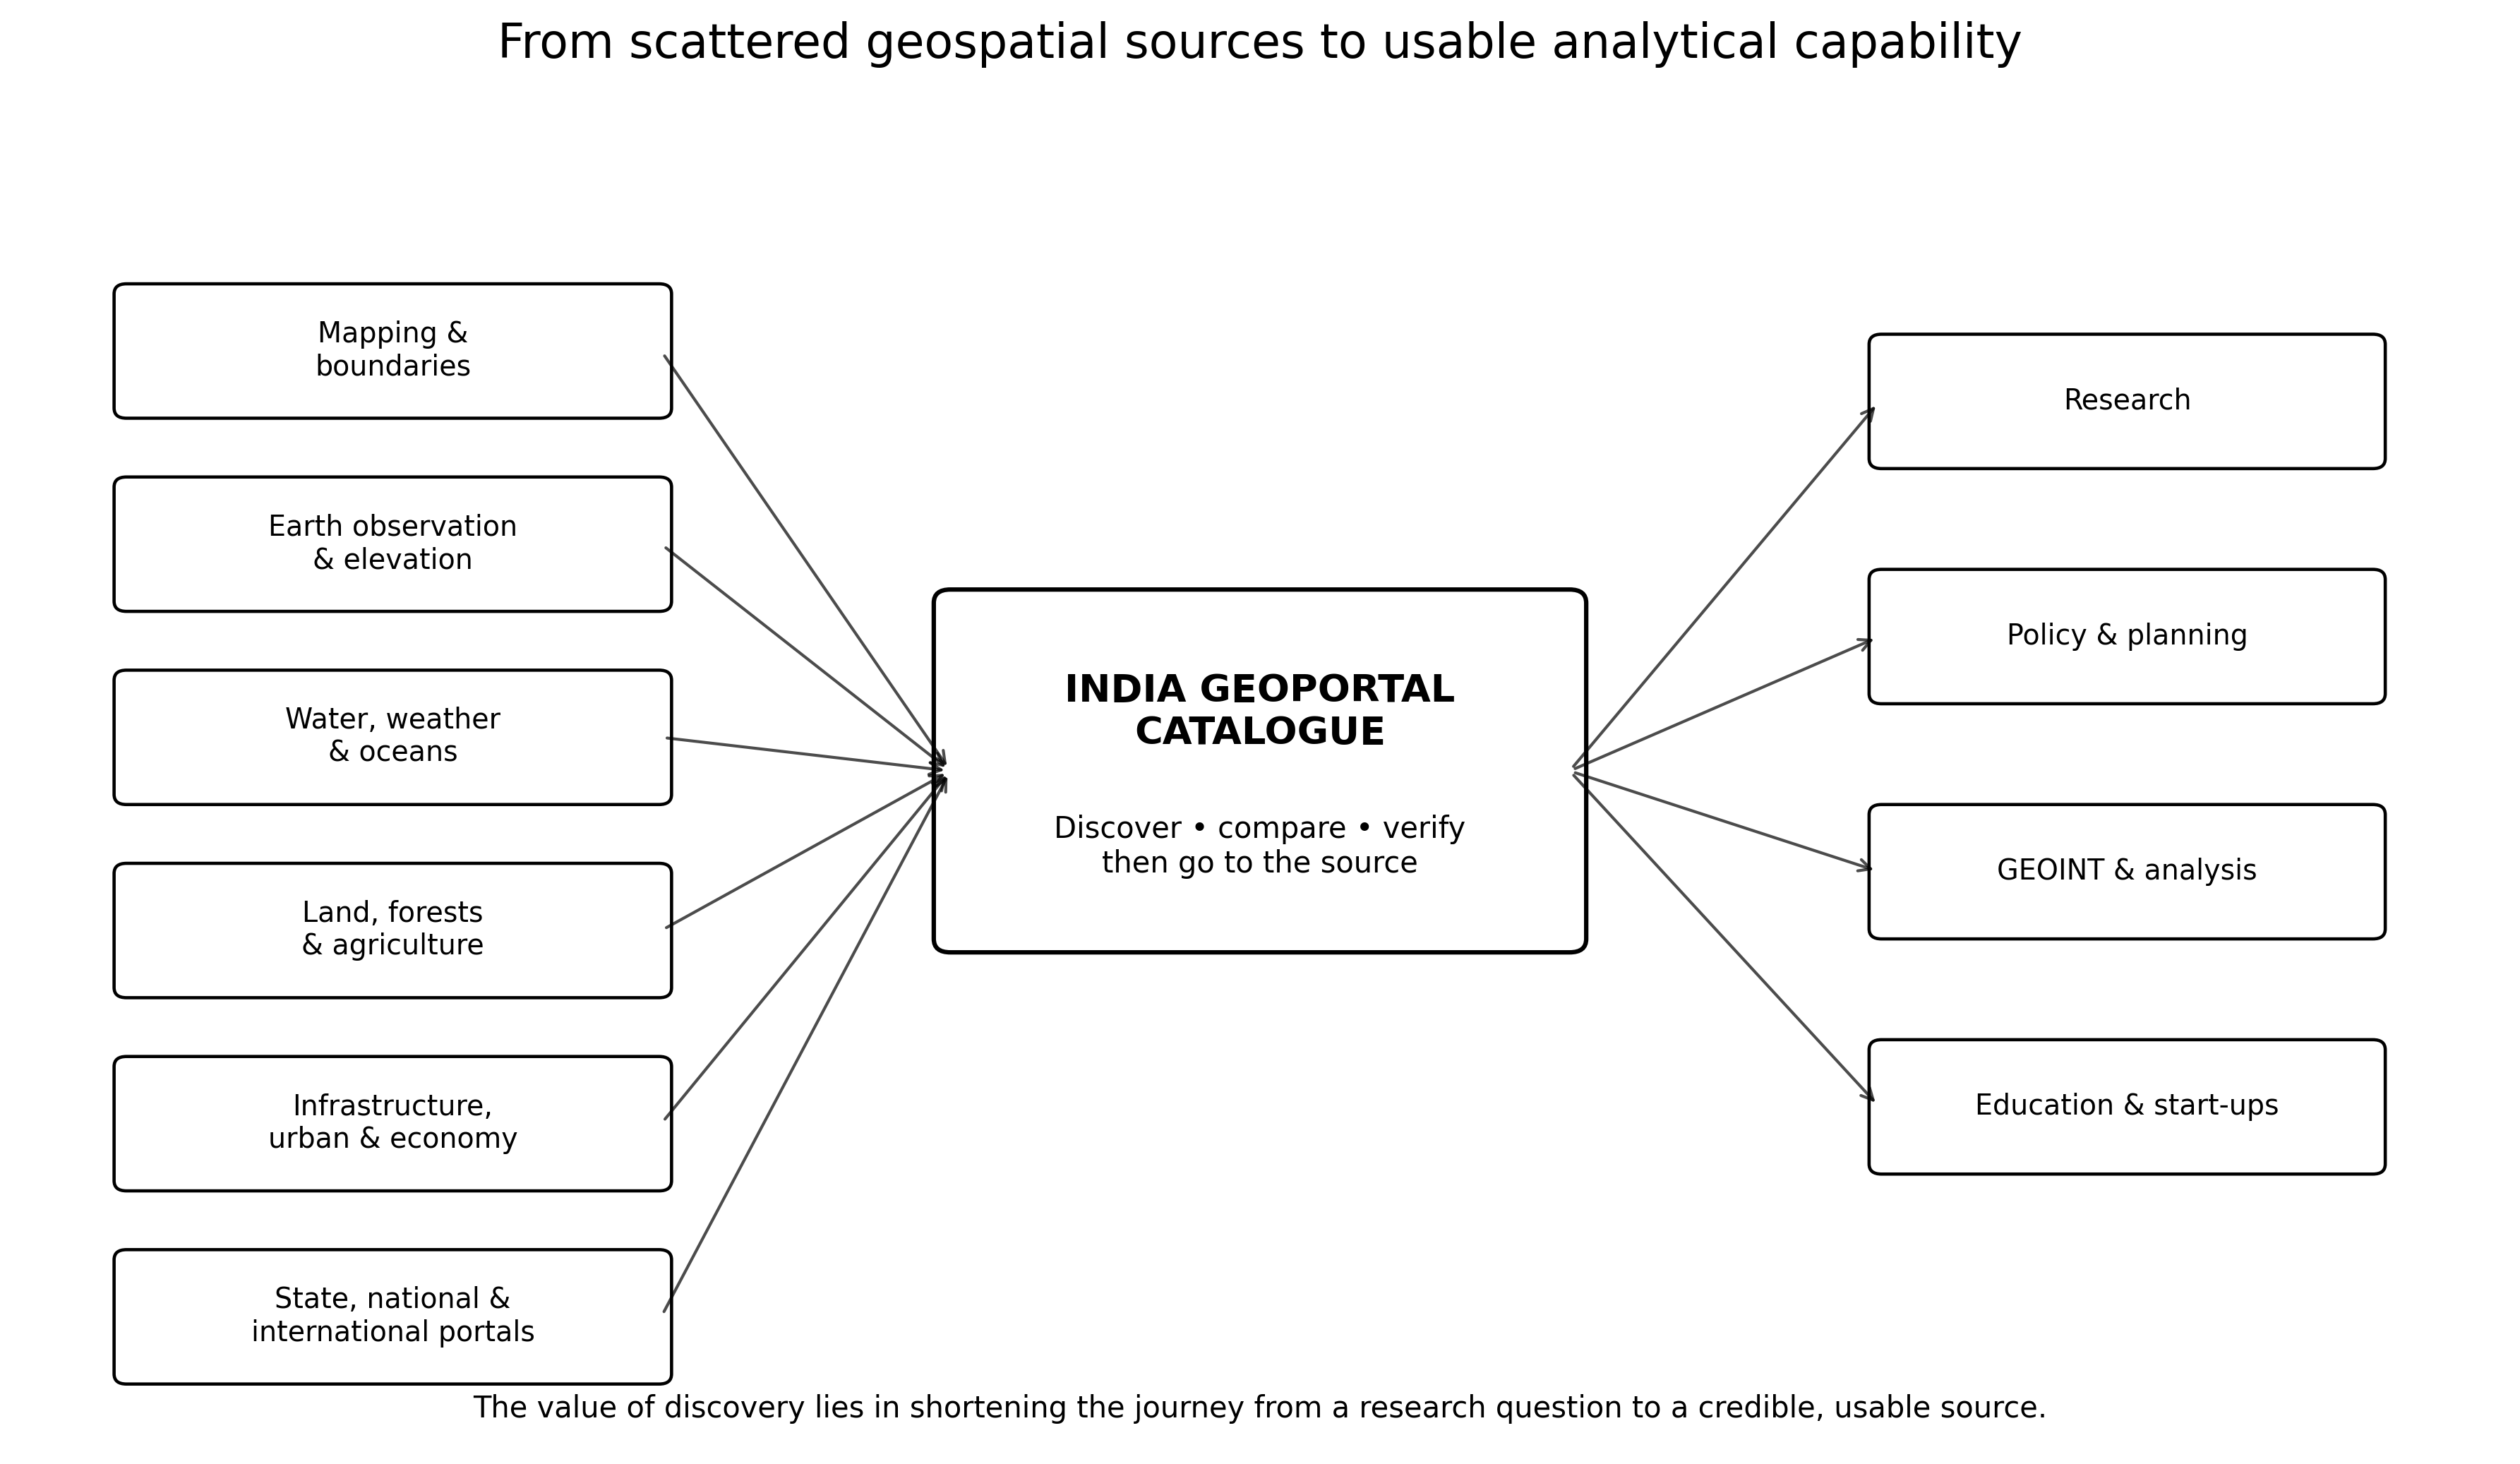
The catalogue is not comprehensive, and it does not claim to be. Many datasets and sources are still to be identified, verified and added. As the geospatial ecosystem expands, the increasingly difficult task will be to distinguish between data that is authoritative, credible and traceable and data that is duplicated, outdated, modified or even fabricated.
This challenge will become even more important in the age of AI. Creating, copying and republishing datasets is becoming easier. Knowing where a dataset came from, who produced it, when it was updated and whether it is trustworthy will therefore matter as much as finding the dataset itself.
This is an ongoing project rather than a finished product. New portals will emerge, new datasets will become available, and better ways of cataloguing them will certainly develop. The research team will continue to identify gaps, add sources that may have been missed and improve the catalogue in subsequent editions.
Furthermore, more geospatial datasets will become available as India moves towards its larger ambition of a unified geospatial portal. That step would be important. But perhaps the journey towards complete unification can also be strengthened through well-developed thematic portals covering areas such as agriculture, environment, infrastructure, disasters, oceans or urban development, which can eventually become part of a more connected national ecosystem. As more public datasets become visible, we will also need to pay attention to duplication, interoperability and coordination between institutions.
Ultimately, India’s geospatial story is not just about the number of satellites, sensors, maps or portals it possesses. It must also be measured by what people are actually able to do with the information they produce.
These may sound like questions of data discovery and usability. In reality, they are also questions of national geospatial capacity.
A quick visual tour of the catalogue portal
Access the portal here: https://geoportal-catalog-takshashila.netlify.app/
Related publication:
State of India’s Geospatial Portals – Takshashila Institution. (n.d.). https://takshashila.org.in/content/publications/20251024-State-of-Indian-geospatial-portals.html
Latest Audio Podcast:
Companies now tell Mr Srikant Sastri that their chains have been removed. Dr Y. Nithiyanandam interacts with the GDPDC Chairman about whether that feeling amounts to an inflection point, what Operation Dronagiri proved in its pilot districts, where geospatial data pays off in agriculture, logistics and infrastructure, whether India can build sovereign capability in GeoAI and hardware, what students should learn now, and why this industry resists measurement entirely.
Latest publication
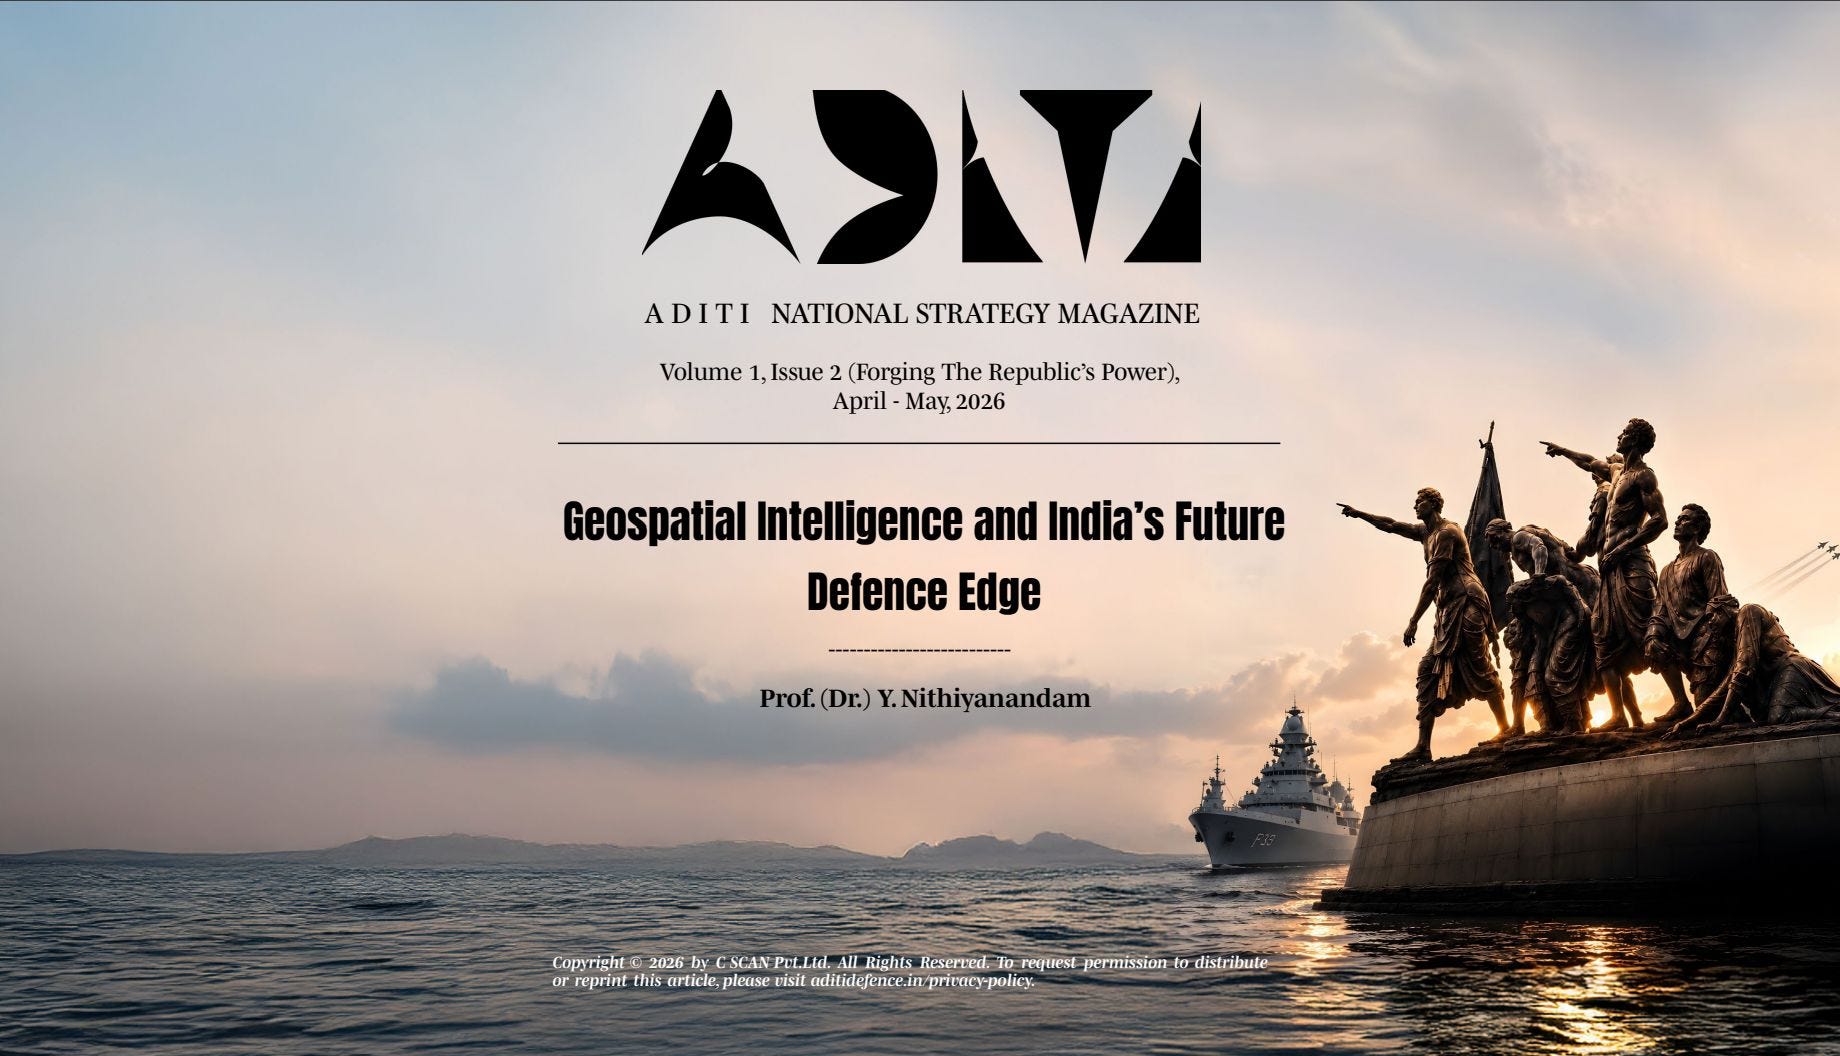
https://read.aditidefence.in/
Disclaimer: Please be aware that this newsletter provides information and opinions intended for informational purposes only. We advise readers to exercise their judgement and consider multiple sources of information before drawing any conclusions or making decisions based on the content presented in this newsletter.
For other newsletters from Takshashila Institution, refer to https://takshashila.org.in/newsletters/
Awesome primer on Geospatial Datasets of India, their credibility and usage. You are doing great work to help the ecosystem ensuring reliability and authenticity.